Master in AI for Architecture and Business Innovation, IAAC (2025/26)
Master's Thesis · Advisor: Shajay Bhooshan · originated in an AI engineering internship at AIT City Intelligence Lab, Vienna
Problem
Urban street design is essentially static, but how people actually use streets changes hour by hour and day by day. The curb — the 2–3 metres at the edge of the road — is reserved almost entirely for parked vehicles, yet drivers, delivery vans, cyclists, pedestrians, diners, markets and accessibility users all compete for the same strip. Cities decide how to allocate it through manual observation, political feedback and pilot testing rather than data. New York's Dynamic Curb Management (2021) and Seattle's Flex Zones (2015) both point toward multi-functional, time-varying curbs, but neither runs on a predictive model.
Research Gap
Prior work covers pieces of the problem in isolation — spatiotemporal street classification (Su et al., 2022), parking-behaviour prediction (Hao et al., 2023), and pedestrian-flow forecasting (Sevtsuk, 2021; Asher, 2025) — but no existing framework jointly models parking and pedestrian activity to drive curbside reallocation, and none carries that from classification through forecasting to intervention. That is the gap this thesis addresses.
Research Question
"How can we reallocate curbside functions based on streets' temporal behaviour, with the assistance of data-driven methods, using parking and pedestrian activity?"
Three sub-questions structure the work: which streets have temporal flexibility windows that make reallocation viable; what spatio-temporal factors drive a street's behaviour; and how a single-street intervention propagates across the surrounding network.
Solution
An AI-driven framework that analyses parking occupancy and pedestrian activity across a joint spatiotemporal street network, identifies curbside reallocation opportunities, and simulates their network-wide impact. Melbourne is the case study, chosen for its open real-time sensor data.
Pipeline
The system runs as an 11-step pipeline across three phases.
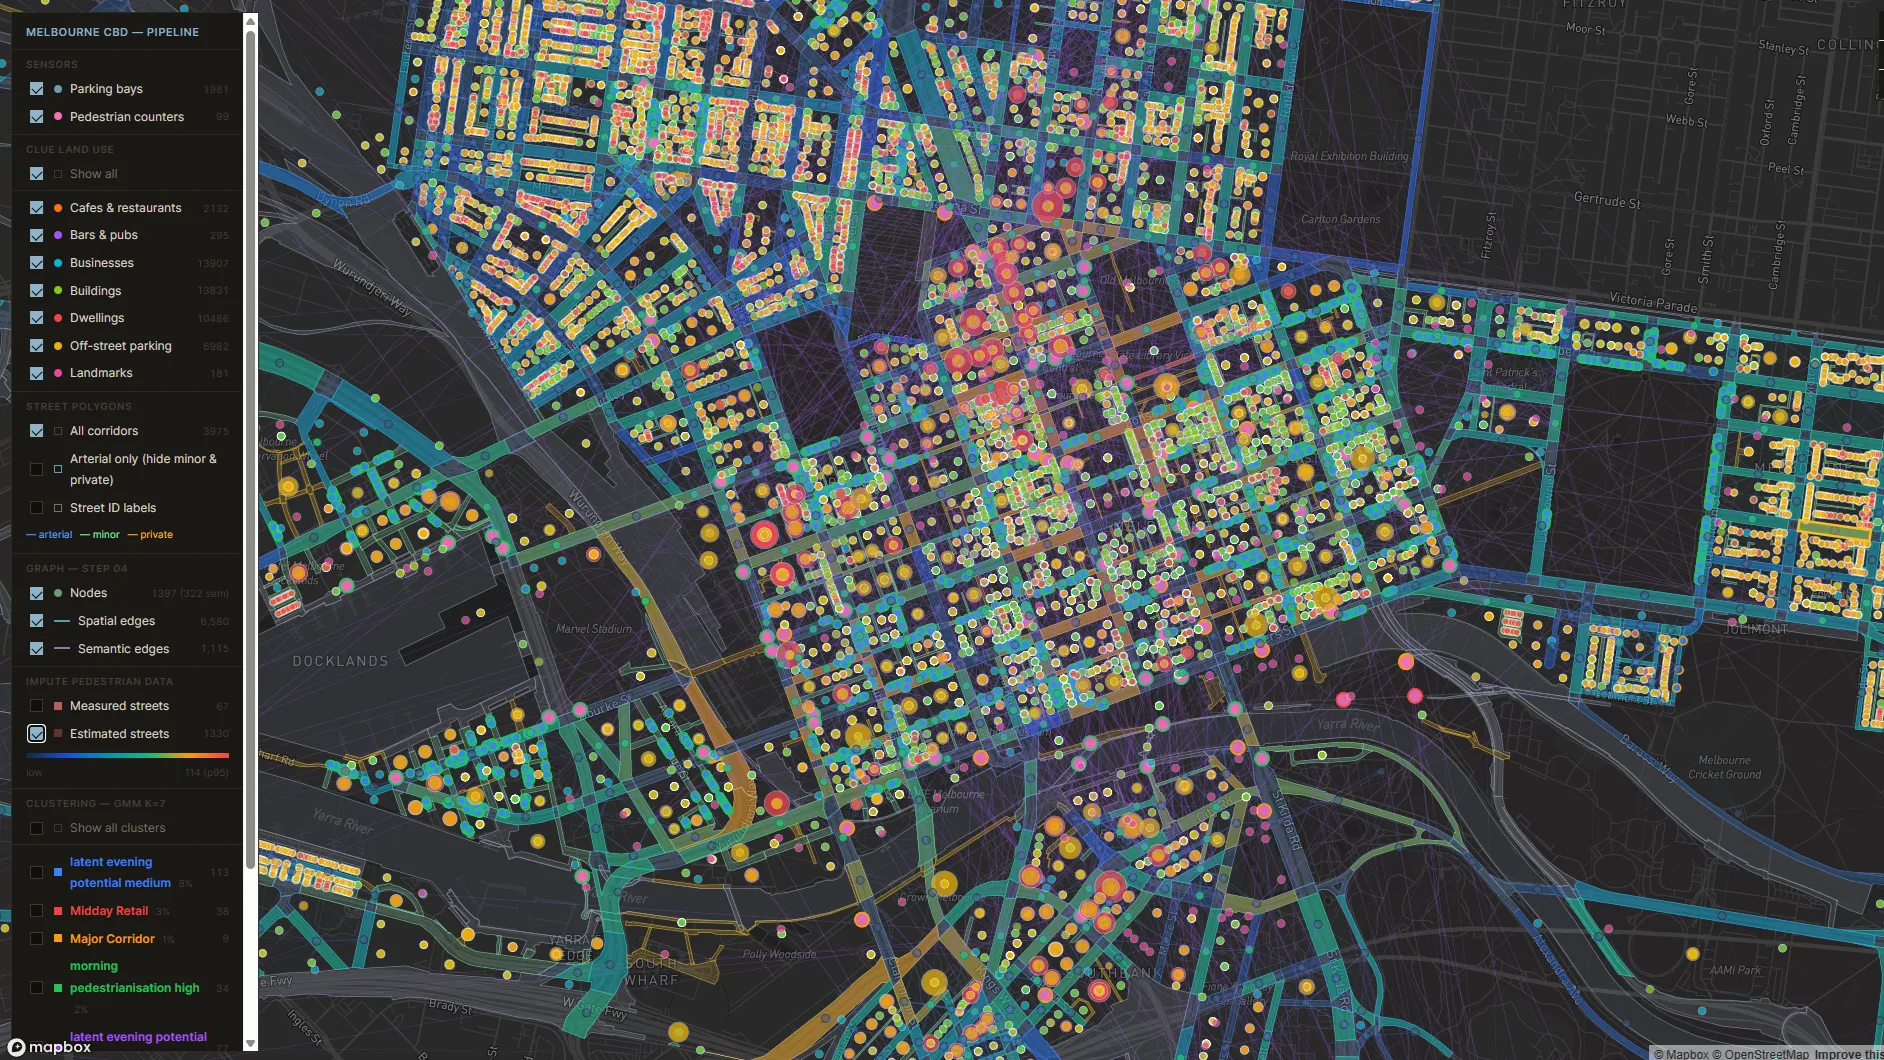
Data foundation. An automated GitHub Actions workflow has been fetching Melbourne parking-bay occupancy and pedestrian counts every 15 minutes since November 2025, alongside CLUE land-use data (businesses, cafés, bars, dwellings, jobs, floor space, off-street parking), transit stops and Open-Meteo weather. Sensors are snapped to arterial street segments, land-use is aggregated onto each street's geometry, and a dual graph is built — a spatial graph (streets that physically touch) and a semantic graph (streets with similar function and features). Parking logs are reconstructed from arrival/departure events into a continuous 15-minute occupancy rate per street. A key constraint drives the whole design: only 143 streets have parking sensors and 74 have pedestrian counters, so unsensored streets are carried as context rather than dropped.
Analysing streets. Weekly behaviour is compressed into a 42-feature "personality profile" (six time blocks × seven days). A Gaussian Mixture Model (k=3, soft, full covariance) groups the sensor-covered streets into three archetypes — high-activity corridors, reallocation-priority streets, and latent streets to activate — giving each street a probability of membership rather than a hard label. All signals are then fused into a single data cube of shape 1,397 streets × 14,400 time bins × 23 features (~1.85 GB), with the graph edges serialised alongside it.
Modelling. A dual-head MultiGCN reads the cube: a spatial-graph branch and a semantic-graph branch each produce 64 hidden features, which are concatenated (128-dim per street per step) and passed through a 2-layer GRU over a 96-step (24-hour) window. Two heads then predict the next step of pedestrian flow (all 1,397 streets) and parking occupancy (the 143 sensored streets).
Results
At the best epoch both heads reach R² ≈ 0.89 (pedestrian 0.888, parking 0.885). Crucially, keeping unsensored streets in the graph as context beats a sensor-only graph by ~8% MAE (24.97 vs 27.16 pedestrians / 15 min) — confirming that network structure carries real signal. Permutation-importance analysis shows the pattern cleanly: land-use sets the level (café count, bar count, points of interest, jobs) while time drives the variation (hour-of-day, day-of-week, weekend and holiday flags).
Scenario Simulation
The trained model doubles as a counterfactual engine. Pick a street, a time window and an intervention, and it runs a treated forecast against the natural baseline forecast; the delta is the intervention's effect, including spillover onto neighbouring streets. Example: fully pedestrianising Lonsdale Street (Elizabeth–Queen) on a Friday 8 pm yields +369 extra walking trips (+46 peds / 15 min) with parking freed up, and measurable effects on four adjacent streets.
The Interactive Tool
The whole framework ships as a live web tool — "Plan the curb, watch the city answer." It turns the CBD's live sensor network into a model you can question: choose a street, read its 24-hour activity and land-use profile, pick an intervention (outdoor dining, greening/parklet, or pedestrian plaza), and watch footfall ripple across a 3D city before anything is built.
Stack
Python · Pandas · NumPy · scikit-learn · XGBoost · PyTorch · PyTorch Geometric · GeoPandas · GIS libraries · GitHub Actions · SQL · Mapbox · Git · Bash